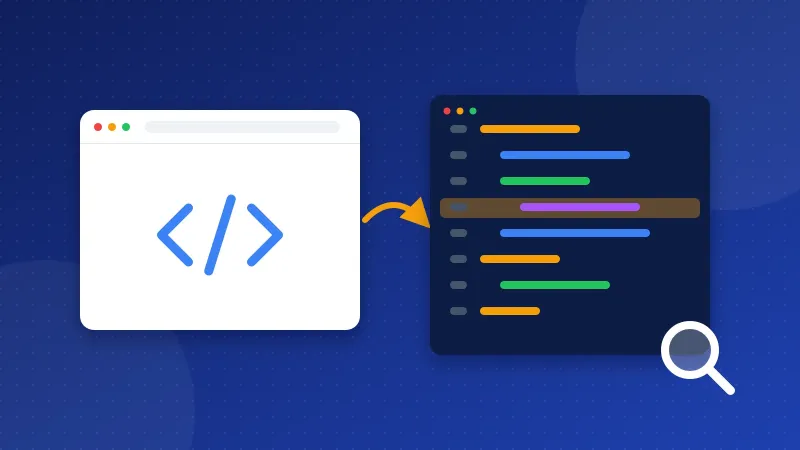
To view page source online, type a web address and this tool shows the raw HTML the server sends, with line numbers, search and line wrapping. It works on a phone, where browsers hide the "View source" option, and on pages you cannot open yourself. With PRO you also see the response headers, every redirect, the page as Googlebot or Bingbot gets it, and tables of links, images, meta tags and headings.
Why look at the source at all?
What you see in the browser is the page after JavaScript has run, after fonts and images loaded and after any pop-up appeared. The source is what the server sent first. Many SEO questions are answered only there:
- Is there a
noindextag you did not know about? - Which canonical URL does the page name?
- Are the title and meta description the ones you typed, or did a plugin replace them?
- Is the article text in the HTML, or does it appear only after JavaScript runs?
- Which structured data blocks are on the page?
The last point matters more every year. Google renders JavaScript, but later and not always fully. Many AI crawlers read only the HTML and do not run scripts at all. If your main text is missing from the source, those crawlers see an empty page.
How to view page source online with this tool
- Enter the address of the page, with or without
https://. - Click "View source". Our server fetches the page, follows up to 8 redirects and shows the HTML with line numbers. You see the answer code, the final address, the size and how long it took.
- Search. Type a word such as
canonical,noindexorld+json. Matching lines are marked, and Enter or the arrow buttons jump between them. - Wrap long lines if the page is minified into a few very long lines.
- Copy the whole source to paste into another tool, such as the Schema Checker.
Only HTML and other text files are shown, up to 2 MB. Nothing you look at is saved on our server.
Reading the answer line
Above the source the tool shows four facts. Each one can explain a problem before you read a single line of HTML:
- Answer: 200 means OK. A 404 or 410 means the page is gone, and a 5xx code means the server failed. A page that should not exist but answers 200 is a "soft 404" to Google.
- Address: the final URL after redirects. If it differs from what you typed, the page redirects, and internal links should point straight to the final address.
- Size: very large HTML, over about 1 MB, often means inline images or huge scripts that slow phones down.
- Time: how long our server waited for the full page. A slow answer on every page usually points to hosting or a missing page cache.
What the PRO tabs add
| Tab | What you see | Use it to |
|---|---|---|
| Headers | Every response header except cookies | Find X-Robots-Tag, caching, compression and security headers |
| Redirects | Each hop with its answer code | Spot chains like http → https → www → page |
| Links | Every link with its text and rel value | Check nofollow, sponsored and links to other sites |
| Images | Every image, its alt text and whether width and height are set | Find missing alt text and causes of layout shift |
| Meta & headings | Title, all meta tags, canonical, hreflang and H1 to H6 | See the page outline and its head tags at a glance |
Each table can be downloaded as CSV. The PRO level can also fetch the page with the published user agent of Googlebot (smartphone) or Bingbot.
What "as Googlebot" can and cannot show
Some sites send different HTML to search engines than to visitors, for example a page without a cookie wall or with prerendered content. Fetching with Googlebot's user agent shows what such a site sends to that name. That is useful to catch mistakes, such as a security plugin that blocks anything calling itself Googlebot.
It is not proof of what Google sees. Careful sites check that a visitor claiming to be Googlebot really comes from Google's IP addresses, and our server is not Google. Those sites will send their normal page. For the real answer, use URL Inspection in Google Search Console, which shows the HTML Google itself rendered.
Source code, rendered code and the inspector
| View | Where | Shows |
|---|---|---|
| Page source | This tool, or Ctrl+U on a computer | HTML exactly as the server sent it |
| Inspector (DOM) | F12 in Chrome, Edge or Firefox | The page after JavaScript changed it |
| Rendered HTML in URL Inspection | Google Search Console | What Google's renderer produced |
When the three differ, the source is usually the one that tells you why. A text that appears in the inspector but not in the source was added by JavaScript.
Quick checks worth doing on your own pages
- Search for
noindexon every important page after a redesign or a plugin update. - Search for
canonicaland confirm it points to the page itself. - Search for a sentence from your article to confirm the text is in the HTML.
- Count the
<h1matches; one is usually right. - Search for
http://on an https page to find mixed content, then fix it with the Mixed Content Checker.
Run these checks whenever something looks off in Search Console. When you need the real HTML and not the polished screen, view page source online here first.
Frequently asked questions
How do I view page source on a phone?
Mobile browsers mostly hide the option. Type the address into this tool instead, or in Chrome on Android put view-source: before the address in the address bar.
Why is the source different from what I see in the browser?
The browser runs JavaScript, which can add, remove or change content after the HTML arrives. The source shows only what the server sent first.
Can this tool see pages behind a login?
No. Our server fetches the page like a new visitor without cookies, so it sees the login page or the public version.